Wind Vision

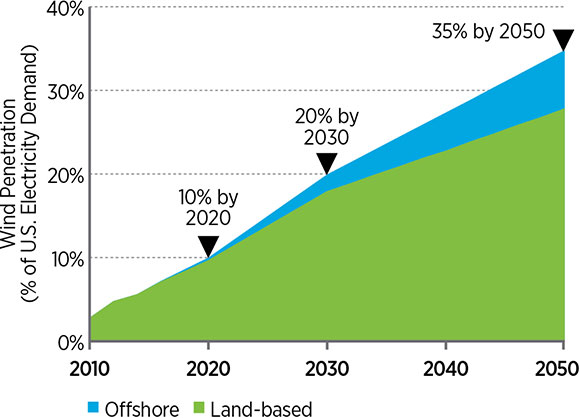
The Wind Vision report updates the Department of Energy's 2008 20% Wind Energy by 2030 through analysis of scenarios of wind power supplying 10% of national end-use electricity demand by 2020, 20% by 2030, and 35% by 2050.
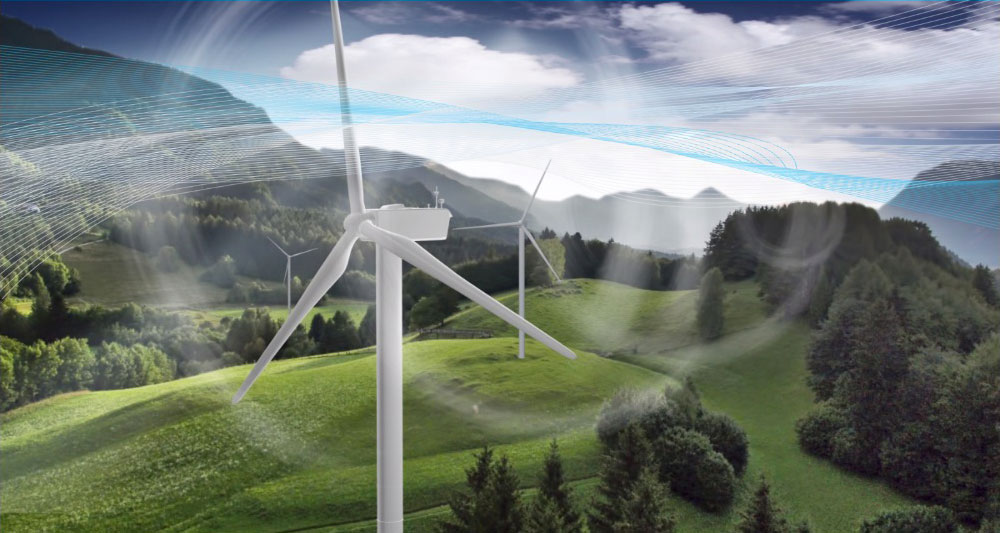
With more than 4.5% of the nation's electricity supplied by wind energy today, the Department of Energy has collaborated with industry, environmental organizations, academic institutions, and national laboratories to develop a renewed Wind Vision documenting the contributions of wind to date and envisioning a future in which wind continues to provide key contributions to the nation's energy portfolio. Building on and updating the 2008 20% Wind Energy by 2030 report, the Wind Vision report quantifies the economic, environmental, and social benefits of a robust wind energy future and the actions that wind stakeholders can take to make it a reality.
Learn more about the U.S. Department of Energy Wind Program.
Project Perspective and Approach
The Wind Vision assesses future wind power growth using a Business-as-Usual framework and sensitivities on key variables such as wind power costs, fossil fuel prices, and electricity demand. This evaluation assists in identifying a credible scenario for further analysis of costs and benefits and in highlighting future actions that could support continued wind growth.
Analytical Framework of the Wind Vision
| Wind Vision Study Scenario | The Wind Vision Study Scenario applies a trajectory of 10% of the nation's end-use demand served by wind by 2020, 20% by 2030, and 35% by 2050. |
|---|---|
| Baseline Scenario | The Baseline Scenario applies a constraint of no additional wind capacity after 2013 (wind capacity fixed at 61 GW through 2050). This allowed the team to identify and quantify impacts for all future wind deployment. |
| Business-as-Usual Scenario | The Business-as-Usual Scenario does not prescribe a wind future trajectory but instead models wind deployment under policy conditions current on Jan. 1, 2014. |
Understanding the Future Potential for Wind Power
At the core of the Wind Vision is an assessment of costs, benefits, and impacts from wind deployment. This requires a future scenario, called the Wind Vision Study Scenario, and a Baseline Scenario. The Study Scenario is based on the Business-as-Usual Scenario and related sensitivity analyses, with bounds based on wind power cost reduction, high fossil fuel prices, or a combination of both.

Wind Vision Study Scenario relative to the Business-as-Usual Scenario and sensitivities
Defining a Credible Scenario To Calculate Costs, Benefits, and Other Impacts
The Wind Vision Study Scenario was identified as a credible scenario that extends wind deployment trends, leverages the domestic wind industry manufacturing base, and complements the broader literature. The Study Scenario is represented by wind power penetration levels of 10% by 2020, 20% by 2030, and 35% by 2050. Impacts from the Study Scenario are compared to a Baseline Scenario in which wind capacity is fixed at 2013 levels. This allowed the team to identify and quantify impacts for all future wind deployment.
The Wind Vision Study Scenario and Baseline Scenario

Wind Power Markets and Economics
In the U.S., new investments in wind plants averaged $13 billion/year between 2008 and 2013. The import share of selected large wind equipment declined from 80% in 2006–2007 to 30% in 2012–2013, and the levelized cost of energy from wind in good to excellent resource sites declined by more than one-third from 2008 to 2013. Low natural gas market prices and their impacts on wholesale electricity prices, along with low energy growth since 2008 and a lack of stability in federal policy (such as the production tax credit), have influenced wind power deployment.

Historical wind deployment variability and the production tax credit
National Social and Economic Impacts of Wind
New investments in wind can support domestic employment in an array of fields, including construction, engineering, transportation, manufacturing, and operations and maintenance. These new investments may also spur increased local economic activity as construction increases demand for retail goods and services in project host communities and long-term operations support new revenues in the form of land lease and property tax payments. Nationally, wind deployment delivers public health and environmental benefits, including reduced greenhouse gas emissions, reduced air pollutants, and reduced water consumption and withdrawals.
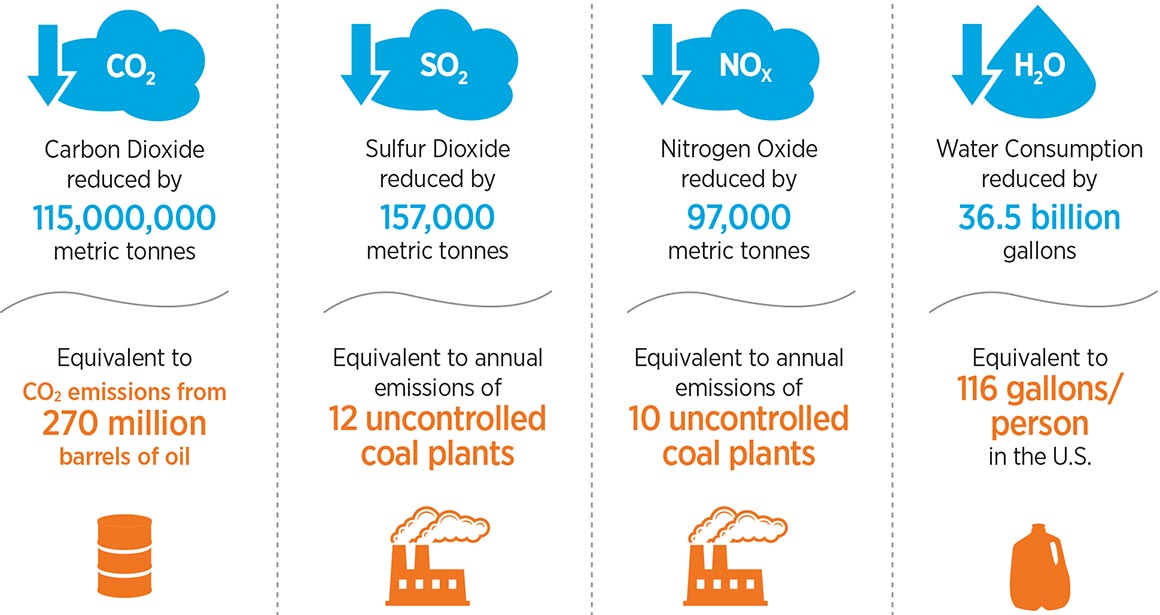
Estimated emissions and water savings resulting from wind generation in 2013
Wind Technology, Manufacturing, and Logistics
Continued advancements and scale-up of turbine technology have helped reduce wind power costs and enable broader geographic deployment of wind power. Technology advancements now center on complementing larger wind turbines with enhanced siting strategies and advanced control systems for arrays of turbines. Provided domestic demand remains stable, domestic manufacturing could continue to expand.
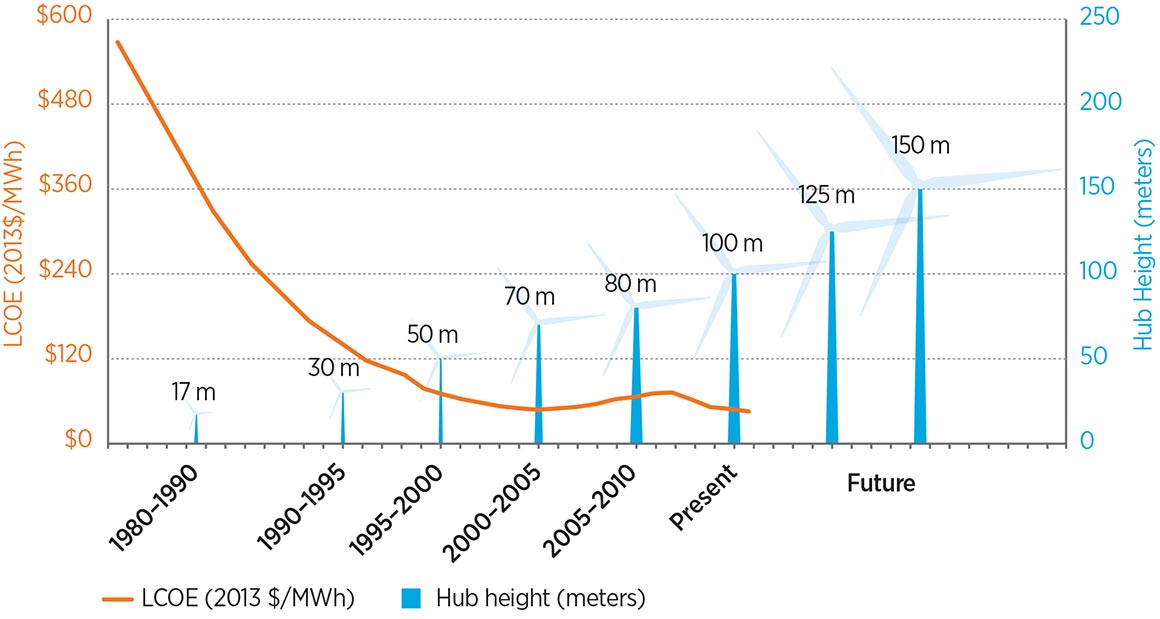
Wind technology scale-up trends and the levelized cost of electricity
Wind Deployment: Siting, Regulation, and Collaboration
From 2008 to 2013, wind power installations expanded in geographic deployment and cumulative capacity. Wind power contributed 4.5% of U.S. electricity demand in 2013 and operated in 39 states. To encourage future growth, collaborative groups are addressing issues from permitting and environmental oversight to manufacturing and workforce training. The wind power community has addressed substantive siting and regulatory issues and continues to work to streamline regulatory processes.

Utility-scale wind deployment through 2013

Wind Industry and Electric Sector Impacts
In the Central Study Scenario, total installed wind capacity increases from 61 GW at year-end 2013 to 113 GW by 2020, 224 GW by 2030, and 404 GW by 2050. The Study Scenario supports new capacity additions at levels comparable to the recent past but drives increased demand for new wind turbine equipment as a function of repowering needs. The Study Scenario suggests continued geographical diversity in wind power deployment.

Summary of wind industry and other electric sector impacts in the Central Study Scenario
Costs of the Wind Vision Study Scenario
Relative to the Baseline Scenario, the Central Study Scenario results in an approximately 1% increase in retail electricity rates in the near-term (2020) to mid-term (2030) but cost savings by 2050. On a cumulative net present value basis, the long-term system cost reductions outweigh near- and mid-term cost increases across most conditions. On an annual basis, impacts on consumers are estimated to include costs of $2.3 billion compared to the Baseline Scenario in 2020, costs of $1.5 billion in 2030, and savings of $13.7 billion in 2050.
Change in Electricity Prices for the Study Scenario Relative to the Baseline Scenario
| 2020 | 2030 | 2050 | |
|---|---|---|---|
| Central Study Scenario electricity price | 0.06 ¢/kWh cost (+0.6%) | 0.03 ¢/kWh cost (+0.3%) | 0.28 ¢/kWh savings (-2.2%) |
| Central Study Scenario annual electricity consumer costs | $2.3 billion costs | $1.5 billion costs | $13.7 billion savings |
| Study Scenario sensitivity range | +0.2% to + 0.9% | -2.4% to +3.2% | -5.1% to +4.8% |
| Study Scenario annual electricity consumer costs range | $0.8 to $3.6 billion costs | $12.3 billion savings to $14.6 billion costs | $31.5 billion savings to $26.9 billion costs |
Benefits and Other Impacts
The Central Study Scenario results in a 16% reduction in carbon dioxide emissions by 2030 and 23% by 2050 from the electricity sector relative to the Baseline Scenario. Other air pollutants affecting public health also decrease, and water savings accrue in many regions. Other impacts include reduced sensitivity to future fossil fuel price volatility, support for a vibrant wind industry supply chain, and increased tax revenue and lease payments to local communities. In addition, the Study Scenario results in manageable but non-trivial impacts to land use, local wildlife populations, and host communities.

Summary of costs, benefits, and other outcomes associated with the Study Scenario relative to the Baseline Scenario by 2050
Reduce Wind Costs
The Wind Vision indicates that the costs associated with the Study Scenario can be reduced with wind cost reductions. Accordingly, reductions in the levelized cost of energy are a priority focus. This theme includes actions to reduce capital costs; reduce annual operating expenses; optimize annual energy production and reduce curtailment and system losses; reduce financing expenses; reduce grid integration and operating expenses; and reduce market barrier costs.
| Issues Addressed | Continuing declines in wind power costs and improved reliability are needed to improve market competition with other electricity sources. |
|---|---|
| Wind Vision Study Scenario Linkages | Levelized cost of electricity reduction trajectory of 24% by 2020, 33% by 2030, and 37% by 2050 for land-based wind power technology and 22% by 2020, 43% by 2030, and 51% by 2050 for offshore wind power technology to substantially reduce or eliminate the near- and mid-term incremental costs of the Study Scenario. |
| Roadmap Action Areas |
|
Expand Developable Areas
Expansion of wind power into high-quality resource areas is important for realizing the Study Scenario at cost levels described in Wind Vision. Key activities in this theme include actions to expand transmission; responsibly expand developable geographic regions and sites; improve the potential of low-wind-speed locales; improve the potential of ocean and Great Lakes offshore regions; improve the potential in areas requiring careful consideration of wildlife, aviation, telecommunication, or other environmental issues; and improve the potential of high wind resource locations that have poor access to electricity transmission infrastructure.
| Issues Addressed | Continued reduction of deployment barriers as well as enhanced mitigation strategies to responsibly improve market access to remote, low-wind-speed, offshore, and environmentally sensitive locations. |
|---|---|
| Wind Vision Study Scenario Linkages | Wind deployment sufficient to enable national wind electricity generation shares of 10% by 2020, 20% by 2030, and 35% by 2050. |
| Roadmap Action Areas |
|
Increase Economic Value for the Nation
The Wind Vision Study Scenario projects substantial benefits for the nation, but additional steps are needed to ensure these benefits are realized and maximized. This theme includes actions to provide detailed and accurate data on costs and benefits for decision makers, grow and maintain U.S. manufacturing throughout the supply chain, train and hire a U.S. workforce, provide diversity in the electricity generating portfolio, and provide a hedge against fossil fuel price increases. The overall aim is to ensure that wind power continues to provide enduring value for the nation.
| Issues Addressed | Capture the enduring value of wind power by analyzing job growth opportunities, evaluating existing and proposed policies, and disseminating credible information. |
|---|---|
| Wind Vision Study Scenario Linkages | A sustainable and competitive regional and local wind industry supporting substantial domestic employment. Public benefits from reduced emissions and consumer energy cost savings. |
| Roadmap Action Areas |
|